| ISO 9000 | ISO 14000 |
GMP Consulting |
|
Creating Large-Scale, Highly Available OLAP Sites: A Step-by-Step GuideDave Wickert Microsoft Corporation Abstract: This paper introduces various techniques needed to create large-scale, highly available online analytical processing (OLAP) sites using Microsoft® SQL Server™ 2000 Analysis Services and Network Load Balancing in a Microsoft Windows® 2000 Advanced Server infrastructure. High availability refers to the ability of a multiple-server site to withstand hardware or software outages that may affect individual servers within a site. A large-scale site is a site that has hundreds of gigabytes (GB) of data, making normal file copy operations ineffective. This paper provides step-by-step instructions that demonstrate how to build the servers and the supporting infrastructure for a reference site based on both thin-client and thick-client architectures. The architectures described are designed to: · Protect the data of a multiple-server OLAP site and keep the site up and running during unplanned outages. · Coordinate the allocation of processing resources during planned outages, such as data refreshes and complex extraction, transformation, and loading (ETL) cycles. · Solve many of the staging-to-production operational problems that can occur in large OLAP sites. The information contained in this document represents the current view of Microsoft Corporation on the issues discussed as of the date of publication. Because Microsoft must respond to changing market conditions, it should not be interpreted to be a commitment on the part of Microsoft, and Microsoft cannot guarantee the accuracy of any information presented after the date of publication. This White Paper is for informational purposes only. MICROSOFT MAKES NO WARRANTIES, EXPRESS OR IMPLIED, AS TO THE INFORMATION IN THIS DOCUMENT. Complying with all applicable copyright laws is the responsibility of the user. Without limiting the rights under copyright, no part of this document may be reproduced, stored in or introduced into a retrieval system, or transmitted in any form or by any means (electronic, mechanical, photocopying, recording, or otherwise), or for any purpose, without the express written permission of Microsoft Corporation. Microsoft may have patents, patent applications, trademarks, copyrights, or other intellectual property rights covering subject matter in this document. Except as expressly provided in any written license agreement from Microsoft, the furnishing of this document does not give you any license to these patents, trademarks, copyrights, or other intellectual property. Unless otherwise noted, the example companies, organizations, products, domain names, e-mail addresses, logos, people, places and events depicted herein are fictitious, and no association with any real company, organization, product, domain name, email address, logo, person, place or event is intended or should be inferred. У 2001 Microsoft Corporation. All rights reserved. Microsoft, PivotTable, Windows, and Windows NT are either registered trademarks or trademarks of Microsoft Corporation in the United States and/or other countries. The names of actual companies and products mentioned herein may be the trademarks of their respective owners. Table of ContentsBuilding Large-Scale, Highly Available OLAP Sites RAID Configuration and Analysis Services A Highly Available Reference Site Architecture The VPN and the Domain Controller/DNS Server Transition from Staging to Production Network Load Balancing Failover Monitoring the Health of the Cluster Analysis Services Restrictions Query Logging for the Usage-Based Design Wizards Thin-Client vs. Thick-Client Access Appendix A: A Step-by-Step Guide Appendix D: Cluster Service Configuration
IntroductionThe pace of the business world is steadily increasing, sometimes exponentially. Because of this, knowledge workers are presented with many challenges. Customers expect excellent service, businesses outsource noncore functions, and the market demands great financial performance. In short, knowledge workers are expected to do more with fewer resources. The tools they use for analysis are critical and must be flexible and adaptable in a changing business climate. In addition to the pace of change, the amount of data continues to increase exponentially. It is not uncommon for decision-support systems to encompass hundreds of gigabytes (GB) of data. Lastly, the Internet is rapidly changing how information is delivered to end users. While many approaches are possible, end-user access is commonly classified as either thin-client or thick-client. Thin-client means that the only component of an application installed on the end-user's computer is a Web browser. Thick-client means that additional components of the application are installed on the end user's computer. Because both approaches are reasonable and appropriate, the application and network architecture must be flexible enough to implement either approach. The architecture presented in this white paper is based on a business intelligence application that provides e-commerce data to its clients. The architecture is based on Microsoft® SQL Server™ 2000 Analysis Services and Microsoft Windows® 2000 Advanced Server. Business intelligence solutions differ from and add value to standard operational systems and Internet applications in three ways. These solutions: · Provide the ability to extract, cleanse, and aggregate data from multiple operational systems into a separate data mart or data warehouse. · Store data, often in a star schema or multidimensional cube (OLAP) format to enable rapid delivery of summarized information and the capability to drill down to details. · Deliver personalized, relevant informational views, and querying, reporting, and analysis capabilities that go beyond the standard reporting capabilities of transaction-based systems — a requirement for gaining better business understanding and making better decisions faster. While not all business intelligence applications use online analytical processing (OLAP) techniques, OLAP solves problems in many systems, and its uses are increasing. As OLAP applications continue to expand and evolve to address the needs of the business intelligence community, it has become increasingly necessary to host applications on a flexible platform that provides scalability, reliability, and availability. Today, most OLAP applications are not required to meet the scalability and availability standards that mission-critical applications must meet. This is changing rapidly, however. For some companies, the end product is the data itself; in other companies, OLAP data is used to direct the day-to-day operations of the company. This white paper addresses the needs of such companies by presenting a reference site architecture that combines Web site techniques with OLAP applications. GoalsThe reference site architecture described in this paper meets the following goals: · It uses flexible data access techniques so information can be gathered from various sources, such as RDBMS, flat files, and Microsoft Excel spreadsheets. · It uses an automated process for updating the production cubes that requires little or no operator intervention. The process is customizable. For example, you can add reconciliation steps, allowing administrators to validate the data before it is moved into production. · It delivers data in near real-time and in an online format that allows drilldown and analysis, including basic support for pivoting and slicing. · It includes Microsoft products such as Microsoft Office 2000 to provide end-user access to the data, but the architecture also allows advanced end users to run tools based on sophisticated, emerging technologies such as data mining and visualization. · It supports remote administration in a lights-out environment. · It delivers services in a robust, highly available fashion. Users expect services to be available 24 hours a day, seven days a week, 365 days a year. · It delivers data over the Internet, but the architecture is flexible enough to allow the same infrastructure to be used for in-house intranet applications. · It demonstrates an architecture constructed using common, off-the-shelf hardware from various hardware vendors and current Microsoft software products. The architecture uses a wide range of products and services to provide: · High availability. Network Load Balancing, a feature of Windows 2000 Advanced Server, is used to create clusters of servers without a single point of failure. The database servers are also clustered together for high availability during the staging of end-of-period data processing. · Scalability. If additional front-end Analysis servers are required, they can be added quickly and easily without disrupting the existing site. · Throughput for a large volume of data. SQL Server is frequently used in line-of-business applications that contain hundreds of GB of data. It includes Data Transformation Services (DTS) and Analysis Services, which transform data, load data, and process OLAP information. All of the components used in the architecture are included in SQL Server. · Common database tools. DTS uses open OLE DB interfaces, which allow companies to use a wide range of data sources. · End-user access. OLE DB for OLAP is a widely-supported interface that provides access to data stored in SQL Server in any OLAP format. PivotTable® Service, a scaled-down version of SQL Server Analysis Services, acts as an intelligent cache between the client and server. In concert with Excel 2000, PivotTable Service speeds query times and supports offline analysis. This white paper assumes that SQL Server 2000 Analysis Services is being used. For historical purposes, where appropriate, this paper provides additional information about SQL Server 7.0 OLAP Services. However, the techniques and approaches described in this paper have only been verified using SQL Server 2000 Analysis Services. Benefits of This ApproachA well-designed solution addresses the current needs of users, providing immediate benefits. It also takes future situations into account, providing future benefits. The future benefits that a solution can deliver is called its flexibility. The more flexible the solution, the greater its potential benefits. Immediate BenefitsThe solution proposed in this white paper provides the following immediate benefits to administrators and users: · By providing appropriate information to end users, you can empower them to use and reuse information in different scenarios. This is the real power of OLAP applications. · By providing remote administration, you have a true lights-out environment. You can administer your system from anywhere over the Internet. · Because there is no single point of failure, the site is robust and reliable. Even if a server fails or is taken offline, the site continues to run. · By delivering information using the Internet, you can: · Reduce delivery cost. · Increase user reach. · Reuse the same infrastructure for administrators. · Implement new applications more quickly (particularly if you use a thin-client approach). · By including a provision for a direct link to the corporate network, you can easily access existing systems in which the source transactional data is located. This reduces cost and improves the speed of developing new interfaces. Future BenefitsThe solution proposed in this white paper provides the following future benefits to administrators and users: · Because the solution uses Network Load Balancing, the cluster of Analysis servers have up to 32 computers. This provides additional capacity for growth. You can also add more CPUs to each server. · Having multiple database servers in the architecture provides additional capacity in case your data staging needs increase. However, before you start using extra servers, weigh the benefits of extra capacity against the impact of a failover. For example, suppose you have two database servers. If your end-of-month processing increases, you can use both of them for data processing, but you do not have failover protection. You may find that you have to balance the failover protection against the overall system processing requirements. · High availability increases end users' acceptance of the data. This is important with decision-support applications because the user always has the capability to add subjective input to the business problem at hand. If the data is unavailable, end users may find it easier to interpret the data on their own rather than relying on the application. If the system is always available, users make decisions using the analysis tools and the available data — with all of the intended benefits. Document OrganizationThis document includes the following sections: · Design Issues — This section is an overview of the architectural issues that commonly arise when building large-scale, highly available OLAP sites. · Building Large-Scale, Highly Available OLAP Sites — This section outlines the architecture necessary for building and maintaining a highly available OLAP site. Windows 2000 Advanced Server provides system services for Windows Clustering, which is the technology that supports the architecture for creating a highly available site. · Alternative Configurations — This section provides suggestions for tailoring the reference architecture to specific situations. · Finding More Information — This section provides links to additional resources that discuss the issues and technology used in this white paper. · Appendix A: Step-by-Step Guide — This appendix provides directions for configuring Network Load Balancing using Windows 2000 Advanced Server, Analysis Services, and its supporting infrastructure for the sample site. · Appendix B: Command-Line Tool — This appendix contains documentation for wlbs, a command-line tool for managing Network Load Balancing clusters. · Appendix C: Sample Scripts — This appendix provides sample scripts for working with Network Load Balancing and Analysis Services (for example, stopping and starting Network Load Balancing and Analysis Services, changing the Analysis Services Data folder, and moving the repository from the Bin folder to the Data folder). · Appendix D: Cluster Service Configuration — This appendix describes how to configure Analysis Services in a server cluster. While this is not a supported feature, it may be an appropriate alternative for some systems. Design IssuesThis document walks you through the steps of building a sample architecture for a highly available and scalable OLAP Internet site using Windows 2000 Advanced Server. The sites described in this document can be used to deliver highly available OLAP services, for either dedicated or shared sites. A similar site design can also be used to host a highly available intranet site. A highly available architecture enables a multiple-server site to withstand planned and unplanned hardware or software outages that affect individual servers within the site. An example of a planned outage is taking a server offline for maintenance to perform a software update. While the server is offline for the software maintenance operation, the rest of the site stays online, providing service to users. An example of an unplanned outage is a hardware failure. In this case, the rest of the site stays online, providing service to users, because the processes that provide data services for the site fail over to the remaining server clusters. The architecture described in this paper is designed both to protect the data of such a Web site and to keep the site up and running. This section discusses some common architectural requirements of large-scale, highly-available OLAP sites: · Clustering for high availability · Building a large-scale staging facility that keeps OLAP data available during cube and partition processing · Moving data into production The solution proposed in this paper addresses these needs. Using Windows ClusteringWindows Clustering enables a group of independent servers to be managed as a single system for higher availability, easier manageability, and greater scalability. The Windows 2000 Advanced Server operating system includes two clustering technologies designed for this purpose: server clusters, known as Microsoft Cluster Server (MSCS), which primarily provides failover support for critical line-of-business applications such as databases, messaging systems, and file and print services; and Network Load Balancing, which balances incoming IP traffic among multiple-node clusters. Both technologies are included as part of Windows 2000 Advanced Server. While either technology can be used alone to achieve a high level of service for a site, the scalability, reliability, and availability of the site is maximized when the technologies are used together to build the site's infrastructure. The reference architecture uses Network Load Balancing for the Analysis servers and Windows Cluster service for the file services and back-end database services. Network Load Balancing was chosen as the primary clustering technology for the reference architecture because it scales well. Network Load Balancing can be configured in two modes: priority mode and multiple host mode. In priority mode, which is usually used when failover is the primary issue, a single server handles all incoming requests and traffic is routed to other servers when that server is unavailable. In multiple host mode, all computers are available to handle incoming requests. For the type of requests that Analysis Services sends, multiple host mode is preferable because it uses all available resources, and balancing is more effective at distributing the load. Unlike server clusters, Network Load Balancing does not require servers to be identical. You can have any combination of computers with different capacities. In addition, Network Load Balancing does not have a specialized Hardware-Compatibility List (HCL). For more information, see the HCL at (http://www.microsoft.com/hcl/). Any system that is capable of running Windows 2000 Advanced Server can be used in a Network Load Balancing cluster. Network Load Balancing distributes IP traffic to multiple copies (or instances) of a TCP/IP service, such as a Web server. For Analysis Services, each Analysis server runs on a host within the cluster. Network Load Balancing transparently divides the incoming client requests among the hosts. From the perspective of the client, the cluster appears to be a single server that answers client requests. As enterprise traffic increases, network administrators can add another server to the cluster. Server clusters are designed specifically to address failover issues. They are not used for scalability. In a server cluster, all systems must be identical (down to the firmware revision level) and the hardware must be chosen from a separate section of the HCL. While Analysis Services can run on server clusters, it is not supported. For more information, see "Appendix D." This document does not describe the features and functions of Windows Clustering and Network Load Balancing. This paper assumes that you have basic knowledge of the Microsoft technologies used in the high-availability scenarios. For more information about these technologies, see "Finding More Information" later in this paper. Building a Staging FacilityA staging facility provides a place to work with data before you move it into production, where users have access to it. By using a separate staging facility, you can work on data without taking your production servers offline. The reference architecture discussed in this paper provides an extensive staging facility to support the additional resources that staging activities require. The facility must be gracefully expandable in case processing or storage requirements exceed the initial capacity. OLAP applications integrate data from many data sources. Obviously, the staging facility must have the disk and CPU resources to handle the data and processing. In addition, the staging facility must often provide resources beyond the sum of the individual data sources. Many online transactional systems keep only a snapshot of the data that they generate, saving only the information necessary for immediate processing. For example, a distribution control system may store shipping records for the current month only, deleting them after an item is received. But because OLAP systems are often used to investigate trends, they usually have longer retention periods. An OLAP system may keep records for 36 or 48 monthsѕmuch longer than its transactional counterparts. Thus, the staging facility may require considerably more storage space and have extra processing requirements to be able to hold and process historical data. Because data may come from many disparate sources, the OLAP system must perform many of the processing steps that large-scale data warehousing systems do. For example, an OLAP system may use data coming from a distribution control system to correlate an invoice number used in the billing system with a shipping number issued by an external shipping company. The OLAP system may filter, cleanse, normalize, and merge the data while processing the cube, or OLAP, data. All of these extra processing steps usually require a separate staging facility. Posting Data into ProductionAfter the data has been scrubbed, transformed, and validated, the data is ready to be posted to the production environment, where users can see and query the data. Traditionally, OLAP applications have used a simple development methodology: 1. Developers and end users work to design a series of cubes. 2. Database administrators locate the appropriate data sources and determine how to filter, cleanse, normalize, and merge the data to build the cubes. 3. The cubes are built and validated. The validation process is done either internally by database administrators or externally by other end users. For example, the accounting department may validate a general ledger report. Typically, this is a one-time activity, performed before the system is deployed. 4. After the cubes are built and validated, end users query them. However, in some applications, more extensive validation must take place before data can be moved from staging to production. There may be reconciliation reports or manual comparisons with different reports, or senior management may need to review financial data and approve its interpretation before the data is posted to the company's books. In this scenario, data must be validated each time it is moved into production (for example, every week or every month). This additional validation means that there must be at least two copies, sometimes more, of the OLAP data: a copy that is currently being seen or used by end users (what is currently in production), and a second copy that is being reviewed or validated (what is currently in staging). When the time is right, the second copy must be copied to production. Various techniques are available for copying data from staging to production, such as archiving and restoring, copying data files, or even physically swapping drives. Consider this issue seriously, because Analysis Services does not provide a built-in facility for copying data between systems, and the reference architecture uses multiple systems for failover and scalability. Whatever process you choose should have a minimal impact on end users. In some environments, it is unacceptable to take the system offline while 100-GB files are copied to computers on the network. Building Large-Scale, Highly Available
|

Computer |
Configuration |
|
VPN1 |
Windows 2000 Advanced Server with VPN,
primary domain controller (PDC), DNS, |
|
VPN2 |
Windows 2000 Advanced Server with VPN,
backup domain controller (BDC), secondary DNS, |
|
AS1 |
Windows 2000 Advanced Server with Network
Load Balancing, |
|
AS2 |
Windows 2000 Advanced Server with Network
Load Balancing, |
|
AS3 |
Windows 2000 Advanced Server with Network
Load Balancing, |
|
Db1 |
Windows 2000 Advanced Server with Windows
Clustering, |
|
Db2 |
Windows 2000 Advanced Server with Windows
Clustering, |
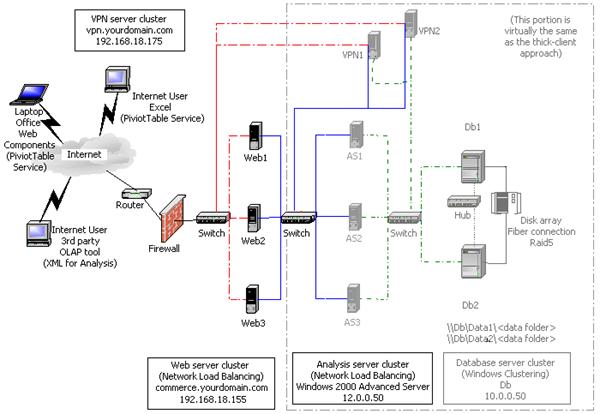
Note All of the system diagrams in the white paper have been simplified for readability. For a production site, you should architect the hardware with full redundancy, that is, dual path power supplies, teamed NIC cards, dual switches and firewalls, and so on, so there is no single point of failure in the configuration.
The architecture illustrated in Figure 1 has data access through the Internet only. Data moves into the site through the VPN. Although this is commonly used in medium-to-small companies, large companies usually have dedicated access through a leased-line back door. For security reasons, you should incorporate a firewall so all of the Internet-facing servers are in a perimeter network (also known as DMZ, demilitarized zone, and screened subnet), which is a network off the router or firewall that acts as a buffer between the external network and your secure internal network.
Figure 2: Reference site architecture (thick-client) or thin-client using the Analysis server cluster for both Web services and Analysis Services (dedicated corporate access)
|
Computer |
Configuration |
|
AS1 |
Windows 2000 Advanced Server with Network
Load Balancing, |
|
AS2 |
Windows 2000 Advanced Server with Network
Load Balancing, |
|
AS3 |
Windows 2000 Advanced Server with Network
Load Balancing, |
|
Db1 |
Windows 2000 Advanced Server with Windows
Clustering, |
|
Db2 |
Windows 2000 Advanced Server with Windows
Clustering, |
Figure 3 shows a third option, which is possible if one of the Analysis servers can be taken offline for cube processing. In this case, you can eliminate the staging servers if the batch windows are longer, or if the data processing steps are not as large. Each server uses its own data storage for the OLAP data.
Figure 3: Reference site architecture (thick-client) or thin-client using the Analysis server cluster for both Web services and Analysis Services (limited processing requirements)
|
Computer |
Configuration |
|
AS1 |
Windows 2000 Advanced Server with Network
Load Balancing, |
|
AS2 |
Windows 2000 Advanced Server with Network
Load Balancing, |
|
AS3 |
Windows 2000 Advanced Server with Network
Load Balancing, |
The VPN and the Domain Controller/DNS Server
DNS host entries for the individual servers on the private 10.0.0.x network must be added to the DNS database on the servers VPN1 and VPN2 so that server names are correctly resolved.
For the sake of simplicity, the reference site scenario uses a PDC (VPN1) and a BDC (VPN2). A BDC is provided so that the domain controller is not a potential single point of failure. Note that the server VPN1 is only part of the private 10.0.0.x network. It is not visible to the Internet.
Vendors must provide user credentials when they access the OLAP cubes. The usernames and passwords they supply should match user account information that is kept in the PDC domain accounts.
The VPN server cluster allows administrators to control these accounts and to administer the computers on the private 10.0.0.x network. Administrators can tunnel into the private network and connect to any of the servers, including the PDC, to administer domain accounts. Windows 2000 Terminal Services is running in administrative mode on all servers in the site.
Important Because this site is set up for clustering with Analysis Services, each installation is configured identically. For example, each server has the same memory allocation and buffer sizes. This allows you to balance connections because Network Load Balancing assumes that each server has the same capacity. If they differ in capacity (for example, more or less memory and CPU speed) or properties, manually adjust the weight in Network Load Balancing to compensate. Server properties are stored in the registry, not the OLAP repository.
Front-End and Back-End Tiers
The reference site scenario discussed in this paper uses a multitiered architecture that provides redundancy and fault tolerance. The architecture is physically divided into two main tiers: the front end and the back end. The front end provides the core Analysis Services facility using HTTP access through Microsoft Internet Information Services (IIS). The back end provides the relational data storage and database services. Database services are provided by SQL Server 2000 Standard Edition. If you choose the thick-client approach, SQL Server Enterprise Edition is required for the front-end Analysis servers because it uses the HTTP connection feature (through IIS) for clients to access cubes on the Analysis server.
The Front End
The reference architecture uses three servers (named AS1, AS2, and AS3) to provide Internet access for the site and respond to requests from users. You can use more servers, but this paper recommends keeping the number as small as possible, based on the anticipated user load and availability requirements. This makes managing the cluster simpler.
The front-end servers provide the OLAP facility for client computers running SQL Server 2000 Enterprise Edition. Client computers access the front-end servers by using OLAP applications from either Microsoft (for example, Microsoft Excel and Microsoft Office Web Components) or vendors. OLAP applications use PivotTable Service on their client computers.
In most cases, PivotTable Service is installed automatically when an OLAP application itself is installed. However, if you want to install or upgrade directly, you can find PivotTable Service on your SQL Server 2000 CD-ROM in the Msolap\Install\Pts subfolder. Two versions are available: PTSFull.exe and PTSLite.exe. PTSLite.exe installs the PivotTable Service files only. PTSFull.exe installs the PivotTable Service files and Microsoft Data Access Components (MDAC). For more information about which to use and the files that will be installed, see "Distributing SQL Server with Applications " in SQL Server Books Online. To install PivotTable Service directly, run one of the executables. It will unpack the software and perform the installation.
PivotTable Service uses three access methods to connect to Analysis servers: XML for Analysis, HTTP, and client-server TCP/IP.
XML for Analysis is a new technology that uses low-overhead Simple Object Access Protocol (SOAP) messages to pass XML containing OLAP data between the server and the client. XML for Analysis is cross-platform, and several vendors are adopting it. Because of these characteristics, XML for Analysis is quickly becoming the access method of choice for many client applications. For more information about XML for Analysis, see "Finding More Information" later in this paper.
The HTTP method uses port 80 and transfers data back and forth as Multipurpose Internet Mail Extensions (MIME)-encoded binary messages. The same messages are passed between the client and the server as in the TCP/IP technique (which is described in the following paragraph), but they use a different transport medium. PivotTable Service determines whether to use the HTTP method or the TCP/IP method based on the connection string. If the server name is a URL, the HTTP method is used.
The TCP/IP method connects to port 2725. This port is not commonly allowed through most corporate firewalls. The network access picture is also complicated, because you don't know the network architecture of the client computers. For example, they could have their own firewalls that limits access to the Internet.
The XML for Analysis and HTTP access methods are new in SQL Server 2000. In SQL Server 7.0, only the TCP/IP method is available. Both the HTTP and TCP/IP access methods require PivotTable Service to be used on the client. XML for Analysis is more lightweight. To use XML for Analysis, the client software is required only to generate XML inside a SOAP message to get data from the Analysis Services cluster.
In the reference architecture, because of a firewall, PivotTable Service is configured to use either the HTTP connection method to the IIS default Web site (port 80) or XML for Analysis. To access the facility, users specify the server name using a URL instead of a regular server name. For example: http://commerce.yourdomain.com/commerce/. This causes PivotTable Service to use the HTTP connection method. Alternatively, the client software, using XML for Analysis, can use this URL to pass SOAP messages and get back OLAP data as an XML stream. Both techniques use HTTP as the underlying protocol and can easily pass through firewalls and other Internet facilities.
Note In SQL Server 7.0 OLAP Services, PivotTable Service connects to the server using ports 2393 and 2394; thus, the Analysis server still listens on these ports to accept connections from SQL Server 7.0 clients. However, PivotTable Service clients in SQL Server 2000 Analysis Services always connect on a single TCP port, port 2725. To use Network Load Balancing with SQL Server 7.0 OLAP Services, you must use the Single affinity setting so that connections to multiple ports from a single client are load balanced to the same OLAP server. This is not an issue with PivotTable Service clients in SQL Server 2000 Analysis Services, because they use a single TCP port.
Role of Network Load Balancing for the Front End
With Network Load Balancing, up to 32 servers work together in a cluster to handle the load of providing data to a Web site. Network Load Balancing is configured on each server in the cluster to respond to the same virtual IP address and fully qualified domain name.
Network Load Balancing provides scalability and load balancing by directing resource requests among the front-end servers to balance the load for the site. The Network Load Balancing load-balancing algorithm determines which server responds to a user request.
When the traffic on the site increases beyond the capacity of the site, a new front-end server can be configured with the Network Load Balancing settings for the site and loaded with a copy of the latest OLAP data. When the new front-end server is brought online in the network, it dynamically joins the existing Network Load Balancing cluster and immediately begins sharing the load with the other front-end servers.
Availability at the Analysis server level is maintained because Network Load Balancing detects when a server that is not responding to network requests and dynamically removes it from the cluster. The remaining nodes pick up the load of the unresponsive server to keep the site running. When a node in a server cluster joins or leaves a Network Load Balancing cluster, an entry in Event Viewer notes the change.
Figure 4: Network Load Balancing NIC roles
To provide name resolution so that external users can access the site, make a host entry in the Internet DNS for the virtual IP address (of the Network Load Balancing cluster) and cluster name (commerce.yourdomain.com).
The Back End
The servers Db1 and Db2 run Windows Clustering and provide highly available data services (file shares and databases) for the site. The file shares are required for the Data folder of the Analysis servers. The databases are optional and are exposed as a cluster-wide service only if the Analysis servers use Relational OLAP (ROLAP) or Hybrid OLAP (HOLAP) storage modes. In most cases, the Multidimensional OLAP (MOLAP) storage mode is recommended, because it makes all of the data available in the Data folder. However, SQL Server can be used internally for other reasons, such as for part of the processing of OLAP cubes, but there is no need to expose it as a cluster-wide service. For more information about storage modes, see SQL Server Books Online.
This cluster of two servers is referred to as the back-end cluster. The back-end cluster is configured in active-to-passive mode, in which one server provides all of the services and the other waits as a hot backup. (In the other possible mode, active-to-active mode, both servers provide services.)
The computers in the Analysis server cluster are configured to always refer to the files (and databases, if used) on the database cluster by the virtual cluster name, and not the names of the individual servers.
For files located on the common cluster-wide file share, an automated procedure that runs in the background keeps all of the data files up-to-date. It uses the file creation and last modified date to determine which files should be copied from the primary server to the warm backup. You can use Robocopy, a file transfer program that is part of the Windows 2000 Server Resource Kit, for this purpose. You can also schedule simple scripts to run periodically that ensure synchronization between the Data folders on the primary and warm standby servers.
Availability
The back-end cluster provides failover capability for services running on the cluster. If one of the servers becomes unavailable because of a hardware failure, planned maintenance, or any other reason, the other server cluster immediately takes over the services of the server that is unavailable. The failure of a server does not cause failure of the data services or interruption in service. When the server is brought back online, it resumes delivery of data services.
Staging Data
The main purpose of the database cluster is to provide the data services for the Analysis Services database located on each of the front-end Analysis servers. Data processing takes place in two environments: traditional and OLAP. For more information, see "Creating a Data Warehouse" in SQL Server Books Online.
Staging Data (Traditional)
Traditional data updates and deletes are processed on the warm standby server. Data is copied from the application's transactional database on the Internet, or available through the Internet. It is copied to the warm standby server. Depending on the amount of new, updated, or deleted information, this data can be quite large. Typically, this data is transactional and is in a highly normalized schema, Third Normal Form (3NF). It is also typically in various storage formats, such as other RDBMS databases, flat files, and Excel spreadsheets.
SQL Server 2000 includes DTS, which automates the data staging process. After the data update process is complete, a reconciliation report should be run and its status sent to the operations group for validation.
When the end-of-day, -week, -month, -quarter or -year processing runs, SQL Server uses the data from the various data sources outlined earlier and updates the transaction data stored on the primary database server. The data on the primary database server should be in a star or snowflake schema RDBMS.
The traditional staging process includes the following steps:
· Extracting data from the transactional data sources.
· Transforming the data (that is, scrubbing and normalizing it). This can involve converting or generating surrogate keys, converting data from various formats such as date/time, and consolidating data (for example, when cost centers merge).
· Loading the data into the star or snowflake schema that is used as the data source for the OLAP cubes and dimensions.
Staging Data (OLAP)
After the traditional staging process is complete, you need to perform additional OLAP processing to rebuild or incrementally update the OLAP cubes and dimensions in the production cubes. The data source for the OLAP cubes and dimensions should be the star or snowflake schema database. The ultimate destination for this OLAP data is the computers that make up the Analysis server cluster, but the data is first processed on the database cluster.
After the OLAP processing is complete, a reconciliation report should be run and its status sent to the operations group for validation. Depending on the complexity of the validation process, you may want a team of users to connect to the newly processed cubes and verify that the data is correct.
The Analysis server service (MSSQLServerOLAPService) runs only on the primary database server while the OLAP processing is taking place (or if Analysis Manager administration is required). The service is started just before the OLAP processing and stopped immediately afterward. Administrators must start and stop the service manually before and after running Analysis Manager. This ensures that the Msmdrep.mdb repository and the Data folder files are consistent, available, and closed during normal operations.
Location of OLAP Data
In the reference architecture, a master copy of the OLAP data is stored in the data storage space of the database cluster. The local disks on the front-end servers store the operational versions of the data. There are several advantages to this combined approach:
· It uses a high-speed, high-capacity RAID disk array in the database cluster. This means that data can be processed more quickly on the staging systems.
· There is a master copy of the data. This means that the process of moving data from staging to production is quicker and data can be copied online without affecting the performance of the front-end servers. After the data is placed on the front-end servers, an update job changes the location of the Data folder. The OLAP data can be copied using several methods, such as:
· DOS COPY or XCOPY commands.
· Robocopy.
· Microsoft Application Center 2000 data replication.
· Third-party data movement products.
· For high speed data transfers, SAN technology. Create a disk mirror set (with two or more members), break them, and then change the underlying device ownership. The net effect of this is an that the disk copy process runs extremely quickly. This is particularly effective for large databases of 50 GB or more.
· Because a master copy of the data is maintained on the database server, it is easy to add a new Analysis server to the front-end cluster. The Analysis server is required only to copy the data and add the host to the cluster — then the server is up and running.
· Because every Analysis server contains its own data, they are not dependent on any outside resource. Performance is consistent, and there is no single point of failure anywhere in the cluster.
Note Consider using Windows 2000 volume sets on the Analysis servers. Volume sets can expand server capacity without requiring you to take the system offline.
· It is easier to manage site content and keep it synchronized when it is located in one place rather than distributed among the local disks on each front-end server.
For the sake of brevity, this paper describes only one method of organizing data. However there are many other architectural choices for hosting data, such as using SAN technology or network attached devices.
Storage Mode
This paper recommends using the MOLAP storage mode for data in the proposed architecture. MOLAP is recommended because the data is self-contained in the Analysis Services Data folder and can easily be moved from the processing server to the Analysis servers. To ensure 100 percent availability of the OLAP facility, you need a mechanism that allows multiple versions of the data to be spread out among the members of the cluster. The data must be independently configured and controlled along with the server being converged into the Network Load Balancing cluster. If you use ROLAP or HOLAP, a single relational database contains (at minimum) the fact data and possibly the aggregates. This complicates the movement of data, because you must copy both relational databases and data files throughout the cluster.
Regardless of the storage mode used, Analysis Services does not support writeback for either data or dimension data. For more information, see "Analysis Services Restrictions" later in this paper.
OLAP Data Storage
OLAP data is stored in the following locations.
|
Location |
Description |
|
The repository (Msmdrep.mdb) |
This is all of the meta data that makes up the OLAP structures on a server (cubes, dimensions, data sources, and so on). For large systems, you should migrate the repository to a SQL Server database. |
|
The Data folder and its subfolders |
When a cube or dimension is processed, the data is stored in a folder hierarchy on a server. To set or determine where that folder is, start Analysis Manager and then right-click the server. Click Properties, and then click the General tab. |
You can also specify the temporary file folder. When cubes, partitions, and dimensions are processed, the temporary folder is used to retain partial aggregations. For large cubes, make sure the temporary folder and the Data folder are on different physical drives.
Security
For security reasons, all of the servers in the example architecture have two Ethernet adapters, each with different IP addressing. All of the servers communicate with each other on a private 10.0.0.x network, and only the front-end servers have IP addresses that are publicly accessible (through a firewall). To prevent malicious attacks, this architecture does not allow direct access from the public network to the servers containing site data. Note that it is possible to have just one Ethernet adapter configured in all of the front-end servers; this provides connectivity to the back-end servers if the servers are configured with publicly-accessible IP addresses. However, this can expose the site data (on the back-end servers) to attacks from the public network.
It is important to have a single logon to all of the computers on the site. Thus, the DNS server is also a PDC so users can use domain accounts for cross-server authentication. All of the computers in the site are part of that domain. A BDC is provided to eliminate a single point of failure in the site.
To prevent access between networks in servers with two Ethernet adapters, make sure that routing is turned off for the TCP/IP protocol. In the Windows 2000 Advanced Server operating system, Routing and Remote Access is an MMC snap-in that is off by default. (To find this snap-in, on the Start menu, point to Programs, point to Administrative Tools, and then click Routing and Remote Access.)
DNS is used for all name resolution; a DNS server runs in the reference site specifically to handle name resolution for the privately addressed interfaces. It is possible to use another name resolution method in this type of architecture, such as Windows Internet Name Service (WINS) or Lmhosts lookup. For simplicity, the scenario discussed in this paper uses DNS only.
The only publicly accessible IP address on the servers in this site is the virtual IP address that the front-end servers respond to. A host entry for the virtual IP address and cluster name (in this example, yourdomain.com) in the Internet DNS is necessary for name resolution for the site from the public network.
The only TCP/IP port that is open on the public Internet NIC cards is port 80. For HTTPS access, port 433 is used. All other ports are disabled.
Besides networking, several IIS configurations should be set up to ensure secure access. For more information, see "Security Issues" later in this paper.
Operational Issues
You must address various administrative and operational issues in the reference architecture before you deploy the site. This section discusses those issues in detail and offers ideas for solutions.
Transition from Staging to Production
A primary goal of building Network Load Balancing clusters is to provide continuous support. Moving the data from staging to production should be a carefully choreographed process.
Be sure to purchase sufficient disk space for each server. There should be enough disk space for two complete sets of data. The first set is used for the operational system. The second set is used when updated data is being copied. There are two approaches that you can use for the local disks. You can use high-quality RAID (5 or 1+0) subsystems with hot-swap capabilities for replacing disks. This means that the I/O subsystem is robust but expensive — probably more expensive than the rest of the server. Alternatively, you can use cheaper equipment and purchase more servers. If the I/O subsystem fails, other servers can pick up the load. Contact your hardware vendor for recommendations suitable to your budget and risk tolerance.
To move data into production, copy the updated Data folder and repository to the local disk drives of the computer on which the Analysis server is running. You can accomplish this through a combination of scripts and file copies. The scripts are used to control membership in the Analysis server cluster and to stop and start services. When a staging Analysis server is updated, move the Data folder and repository to the new location on the local disk drives (by changing the Windows registry settings). Then, restart the MSSQLServerOLAPService service.
If you have enough disk space available for two copies of the OLAP data, you can keep the server online in the cluster during copying and take it offline only when switching the location of the Data folder.
An alternate approach that is particularly useful if the amount of OLAP data is unknown in the planning stages is to use SAN devices. Disk allotments for each server can rise or decrease based on need rather than projections.
If you have only enough local disk space on the Analysis server for one copy of the OLAP data, drainstop the server (when it is being updated from staging), stop the MSSQLServerOLAPService service, and then copy the Data folder and repository before you change the registry settings (this is typically done using a script; for more information, see "Appendix C") and restart the MSSQLServerOLAPService service. This may mean that the server is offline from the cluster for a considerable period of time (limited by network throughput).
Note Drainstopping is a feature of Network Load Balancing that allows you to take a server offline gradually, without interrupting existing connections. When a node is drainstopped, no new connections are accepted, but old ones remain. The server becomes free when all connections made before you drainstopped the node are closed.
Moving Data into Production
After the updated cubes are available on the database server, they must be moved into production.
To move the cubes into production
1. Select two computers in the Analysis server cluster as staging servers. Drainstop both servers so that they drop from the cluster.
2. When both servers are stopped and all connections are closed, stop the MSSQLServerOLAPService service. Issue a net use command so that a known network drive letter (for example, F) is redirected from the old file share on the database server cluster (the old Data folder) to the updated file share. Copy the Analysis Services Data folder and the repository from the network file share to a known folder on a local drive. Run a script (for more information, see "Appendix C") that changes the Windows registry settings for the new location of the Analysis Services Data folder and repository. Restart the MSSQLServerOLAPService service.
3. When both servers are refreshed completely, add the staging server and its backup to the Analysis server cluster. Drainstop the other computers in the cluster. All new connections are made to either the staging Analysis server or its backup. The updated cubes are now available.
Note At this point, the updated cubes are available but the site is susceptible to failures or overload, because only two servers are in cluster. Complete the remaining steps as soon as possible to bring the cluster up to full capacity.
4. Refresh the data on each of the old servers from the database server cluster (Db). Stop the MSSQLServerOLAPService service, change the network mapping for the Data folder from Db, copy the Data folder contents, and then restart the MSSQLServerOLAPService service. You can now add the server back to the Analysis server cluster. Each stopped server can refresh data in parallel.
An alternative technique (depending on the number of computers in the Analysis server cluster) is to select more than one computer as the staging Analysis server. For example, you might select half of the Analysis servers computers for the first refresh. This ensures that a significant number of servers (about half) are in the cluster at any one time.
Application Center 2000
Rather than attempting to control the deployment of the OLAP data manually, consider a more flexible way: Microsoft Application Center 2000. Application Center 2000 is the Microsoft deployment and management tool for high-availability Web applications. Application Center 2000 makes managing groups of servers as simple as managing a single computer.
You should consider using Application Center 2000 as an adjunct technology because:
· It is based on Windows 2000 Server, not Windows 2000 Advanced Server; thus, there may be some cost savings (depending on your configuration).
· It includes built-in manageability and remote administration of Network Load balancing.
· Its architecture is event-driven. This allows you to script your own hooks before you replicate the data (for example, you can automate the starting and stopping of the MSSQLServerOLAPService service).
· It offers built-in tools for monitoring the health of the Network Load Balancing cluster.
Application Center 2000 can control the deployment process of OLAP data quickly and easily. The entire process can be automated and run in a lights-out environment.
Application Center 2000 provides tools that monitor the cluster and its servers. It also includes powerful features that enable the viewing of performance and event-log data for one server or the entire cluster. Administrators can monitor applications remotely using a browser-based console. With automated responses, operational costs are reduced through the elimination of manual tasks. Automated responses also can provide higher availability of applications.
In particular, the use of Application Center 2000 can significantly improve the deployment time and cost of the reference architecture. First, Application Center 2000 includes Network Load Balancing as one of its components and can be installed on a computer running Windows 2000 Server. In Figure 5, all of the computers are running Windows 2000 Server, not Windows 2000 Advanced Server. Thus, Application Center 2000 increases over Windows 2000 Advanced Server only marginally.
Second, the default Network Load Balancing implementation that is included with Windows 2000 Advanced Server requires all management to be done through the command prompt or a batch interface. There is no graphical management console. Application Center includes a graphical management console for managing, troubleshooting, and controlling Network Load Balancing clusters. The graphical management console can be useful in the reference site architecture as well, because it allows operators to graphically administer the Network Load Balancing clusters.
Finally, because the OLAP data is now distributed to the Analysis servers, there is no need for as an extensive back-end system. The back-end system is no longer a single point of failure in the running of the Analysis server cluster. Thus, the less expensive alternatives are to use a single staging server or to take one of the Analysis servers offline for data processing, instead of using Windows Clustering. There may be other business reasons for to use a Windows Clustering back end, a warm backup server, or a second standby server, but it is no longer a requirement.
Figure 5: Reference site architecture using Application Center (Internet access only)
|
Computer |
Configuration |
|
VPN1 |
Windows 2000 Advanced Server with VPN,
PDC, DNS, |
|
VPN2 |
Windows 2000 Advanced Server with VPN,
BDC, secondary DNS, |
|
AS1 |
Windows 2000 Server with Network Load
Balancing, IIS, |
|
AS2 |
Windows 2000 Server with Network Load
Balancing, |
|
AS3 |
Windows 2000 Server with Network Load
Balancing, |
|
Db |
Windows 2000 Server, |
Note All of the member servers should have identical drive lettering and structure.
Application Center provides a management subsystem for controlling the Network Load Balancing cluster and the movement of files through the system. Application Center simplifies the task of migrating data from staging to development. It helps ensure consistency among the Analysis serversѕall servers in the cluster must have the same data. By automating the deployment of the OLAP data from one server to another, Application Center speeds up the transfer time (it has its own high-speed file replication facility), eliminates manual errors, and improves the overall quality of the site.
To implement this configuration, create two applications using the Application Center management console. Each application represents the resources, such as the Data folder files, that are used for that unit of work. In the scenario used in this paper, these two applications represent the two Analysis Services Data folders and the repository. All Application Center management functions have command-line versions so deployment can be easily triggered by the staging process
Application Center actions are used in this scenario. Actions handle the prepare and commit events for the replication process. Each application gets its own event handling script for every action. You should set up action event handlers that address the following situations:
· If there is enough disk space for two copies of the Data folder, your script should:
1. Determine whether the current application is active. On a prepare event for replication, the script should generate an error if the current application is active. It should determine whether an application is active by comparing examining the Analysis Services Data folder registry key with the folder that will be replicated. If they match, the script should stop the job and generate an error. If they are different, it should start copying the data.
Note Do not drainstop the target when deployment starts.
2. On a commit event for replication, drainstop the target Network Load Balancing member and stop the MSSQLServerOLAPService service. The script should switch the folder names by renaming them from the inactive location to the active location, and restart the MSSQLServerOLAPService service.
3. When deployment completes, start the target Network Load Balancing member.
· If there is only enough disk space for one copy of the Data folder, your script should:
1. Drainstop the target when deployment starts.
2. On a prepare event for replication, stop the MSSQLServerOLAPService service.
3. On a commit event for replication, restart the MSSQLServerOLAPService service.
4. When deployment completes, start the target Network Load Balancing member.
Use this technique to keep the target Network Load Balancing member offline for as little time as possible. This demonstrates why having enough disk space available for two copies of the OLAP data is important.
Network Load Balancing Failover
Except when you are using Application Center, you must use scripts to bring a host online in the cluster (that is, to converge it), stop it, drainstop it, examine the status of the cluster, and debug networking problems. For information about a command-line program that you can use in your scripts, see "Appendix B."
"Appendix C" includes some sample scripts for working with Network Load Balancing and Analysis Services. They perform actions such as stopping and starting Network Load Balancing and Analysis Services, changing the Analysis Services Data folder, and moving the repository from the Bin folder to the Data folder.
Monitoring the Health of the Cluster
Cluster Sentinel, which is available in the Windows 2000 Server Resource Kit, is a program for monitoring the state of your Network Load Balancing cluster. Every 30 seconds, Cluster Sentinel automatically requests a special test page from every active server. The Active Server Pages (ASP) code on this page performs several tests on the server. If the tests pass, the page lists them as such. If a test fails, the page request times out, signaling to Cluster Sentinel that an error has occurred.
If the test page on a server times out or returns error code 500 (the HTTP error code for a server error), Cluster Sentinel retries the server in case the error has resolved itself. If the server consistently returns errors, Cluster Sentinel suspends the server, and Network Load Balancing redirects all page requests to the remaining servers in the cluster. When the production staff has located and fixed the error, they restore the server to active operation.
Security Issues
Besides networking, several IIS configurations should be set up to ensure secure access:
1. The only IIS application that should be defined on the Analysis servers should be the Commerce application. The application should configured to:
· Allow Read access only. Clear the Script source access, Write, Directory browsing, Log visits, and Index this resource check boxes.
· Allow only scripts to run. Set execute permissions to Script Only.
2. The only file in the application folder should be Msolap.asp (provided as part of the Analysis Services installation).
On the front-end servers, all Windows 2000 services that are not essential for Analysis Services should be set to manual startup. This helps prevent unnecessary resource usage and removes possible attack points. For example, because File Transfer Protocol (FTP) and Simple Mail Transfer Protocol (SMTP) services are not provided as part of the service offering for the front-end servers, these services are either turned off or not installed on the front-end servers. Also, the NetBIOS interface should be disabled on the front-end servers for the NIC handling all of the public requests. This removes another common attack point.
Depending on the sensitivity of the data being supplied over the Internet, you should acquire the necessary X.509 certificates to run secure SSL sessions. This may mean that you must enable port 433 on the firewall and the public Internet NIC to allow access.
For administrative control of the site, install the VPN service on the VPN servers (VPN1 and VPN2). Several protocols are available for configuring and using a VPN. The setup is different for each protocol. A separate Network Load Balancing cluster is used with VPN1 and VPN2 to provide high VPN availability. A detailed discussion of VPNs is beyond the scope of this white paper. For more information, see "Finding More Information" later in this paper.
Security Checklist
Ensure that the following tasks are complete:
· Configure the firewall so that only port 80 (and possibly port 433, if you are using SSL) is enabled to 198.168.18.155.
· Configure the firewall so only VPN access is enabled to 198.168.18.160.
· Configure the NIC cards on all front-end servers so that only port 80 (and possibly port 433, if you are using SSL) are enabled.
· Configure the NIC cards on all VPN servers so that the appropriate ports are enabled.
· Disable IP forwarding on all front-end servers.
· Ensure that only TCP/IP protocol is used; disable NetBIOS.
· Ensure that only DNS is being used for name resolution.
· Disable all unnecessary services on the front-end servers.
· Ensure that only domain accounts are used for all appropriate services; there should be no local computer accounts.
· Ensure that only one IIS application (in this scenario, Commerce) is enabled.
· For Commerce, which provides the OLAP data, set up the required security. For example:
· Allow only Read access.
· Set the Execute permissions to Script Only.
· Ensure that the only file in the application folder is Msolap.asp.
· If you are running SSL, acquire and install the necessary X.509 certificates to run secure sessions.
Analysis Services Restrictions
Using Analysis Services in the reference architecture outlined earlier has certain restrictions. This section discusses those restrictions and offers ideas for solutions whenever possible.
Query Logging for the Usage-Based Design Wizards
Analysis Services logs a sampling of the queries issued to a file (Msmdqlog.mdb in the Bin folder). The Usage-Based Optimization Wizard and the Usage Analysis Wizard use this log file to design and recommend aggregations. Because there are several Analysis servers in the cluster that execute queries at the same time, the usage log is spread over all of the servers.
To solve this problem, adjust the sampling size to compensate for the fact that multiple servers are performing the queries. (Network Load Balancing makes this possible by distributing queries evenly across the cluster.) To determine the approximate sampling rate overall, take the sampling rate you want (as if the site were on one server) and divide it roughly by the number of servers. For example, if the sampling size is 10 (the default), every tenth query is logged. If you have five Analysis servers, every fifth query is logged. This means that across the cluster, every fiftieth query is logged in each server's log (the other forty are in the logs of the other four servers). Therefore, you should reduce the sampling size to 2.
To change the sampling size, in the Analysis Manager tree pane, right-click the server and then click Properties. Click the Logging tab. Under Log settings, ensure that the Log queries sent to server check box is selected, and then type the new sampling size in the Write to log once per _ queries box.
To use the log file, copy any of the Msmdqlog.mdb files from one of the Analysis servers to Bin folder of the the staging server (Db1 or Db2). Then run the appropriate wizard.
Writeback Data
When you use Network Load Balancing, users cannot write back to OLAP cubes. Multidimensional data must be read-only.
For normal single-server operation, Analysis Services supports changing the data in a cube. If you make a cube write-enabled, client applications can record changes to the data in the cube. These changes, known as writeback data, are stored in a table separate from the cube and its underlying data, but they are incorporated into query results as though they are part of the cube data. Write-enabled cubes allow end users to explore scenarios by changing cell values and analyzing the effects of the changes on cube data.
An end user's change is stored in the writeback table as the difference between the currently displayed value and the original value. For example, if an end user changes a cell value from 90 to 100, the value +10 is stored in the writeback table, along with the time of the change and information about the end user who made it. The net effect of accumulated changes is displayed to client applications. The original value in the cube is preserved, and an audit trail of changes is recorded in the writeback table.
Usually, the writeback table is stored in a ROLAP data source. Even if the underlying RDBMS supports shared, concurrent access with transactions (for example, if SQL Server is the database), there is a problem using this feature on a Network Load Balancing cluster. The MSSQLServerOLAPService service that is running on each of the Analysis servers keeps internal locks, and concurrency problems can occur if several of the Analysis servers attempt to update the same cell at the same time.
For normal single-server operation, Analysis Services supports write-enabled dimensions. Write-enabled dimensions allow end users to modify the contents of the dimension and see the impact on the cube immediately. Unlike updates to a write-enabled cube, which are stored in a writeback table that is separate from the source tables of the cube, updates to a write-enabled dimension are recorded directly in the dimension's table.
Unfortunately, as with the writeback table, the MSSQLServerOLAPService service that is running on each of the Analysis servers keeps internal locks and concurrency problems occur if several of the Analysis servers attempt to change the members of a dimension at the same time.
Repository
The Analysis Services repository (Msmdrep.mdb, which is stored in the Bin folder) is used only for programs that use Decision Support Objects (DSO), including Analysis Manager.
The MSSQLServerOLAPService service does not use the repository for query processing. Although this paper includes instructions for copying the repository along with the Data folder when reconfiguring the Analysis server cluster, it is technically not required at run time.
However, administrators use Analysis Manager for troubleshooting and maintenance purposes. To ensure that the repository matches the Data folder, the repository should be moved from its default location (the Bin folder) to the Data folder. This ensures that when the Data folder is copied from the staging server to the Analysis servers, the associated repository is also copied.
To move the repository from its default location to the Data folder
1. Stop the MSSQLServerOLAPService service.
2. Copy Msmdrep.mdb from the Bin folder where Analysis Services is installed (usually C:\Program Files\Microsoft Analysis Services\Bin folder) to the Data folder.
3. Change the following registry keys so that they point to the Data folder:
· HKEY_LOCAL_MACHINE\SOFTWARE\Microsoft\OLAP Server\Server Connection Info\Locks Directory
· HKEY_LOCAL_MACHINE\SOFTWARE\Microsoft\OLAP Server\Server Connection Info\Repository Connection String
4. Change the MsOLAPRepository$ file share from the Bin folder to the Data folder. Because the RemoteRepositoryConnectionString registry setting is based on this file share by default, it is also updated automatically. However, if you don't move the file share, you must change the registry setting manually.
5. Restart the MSSQLServerOLAPService service.
For information about a sample script that does this programmatically, see "Appendix C."
Another topic that frequently is discussed when an enterprise-level Analysis Services system is put into production is whether the repository should be kept in its default Microsoft Access format (Msmdrep.mdb) or migrated to a SQL Server 2000 database. Each data source has advantages and disadvantages.
For the reference architecture, the repository is kept in the default Access format. This allows you to make multiple versions available online at the same time. If you migrate the repository to an instance of SQL Sever 2000, you must develop an infrastructure for maintaining multiple Analysis Services repositories (probably by having different instances of SQL Server) and change the RepositoryConnectionString registry setting to point to the correct repository instance (that is, the one that matches the Data folder that is currently being used).
Analysis Manager
Because all of the OLAP data is centralized on the back-end systems, you should not run Analysis Manager on the Analysis servers except to troubleshoot problems. Changes should always be made on the database server so that they are propagated to the Analysis servers correctly.
To use Analysis Manager on the Analysis servers, either run it on the server itself or connect remotely using the individual server name or the IP address. You cannot use Analysis Manager to connect to the virtual cluster name. For more information, see the Microsoft Knowledge Base (KB) article Q269156, "System Error 52 When You Connect to an NLB Cluster Name." However, as long as you view the repository without making changes, you can connect to the cluster using its cluster IP address. Making a change is reflected on only one of the Analysis servers, not all of them, and you have no control over or knowledge of which one is responding. Thus, the recommended approach for making cluster-wide changes is to make changes on the database server.
Alternative Configurations
The reference architecture was designed to address specific issues, such as Internet access, and many issues for the majority of sites. It doesn't address all of them, but you easily tailor the reference architecture to meet specific requirements.
Thin-Client vs. Thick-Client Access
The architecture supports both a thin-client and a thick-client approach. Figure 1 shows the thick-client architecture. End users access the cube through PivotTable Service, which is installed on each end user's computer to provide OLAP processing on the desktop. PivotTable Service communicates with the Analysis server through either HTTP (port 80) or a TCP/IP connection (port 2725). Because the scenario discussed in this paper uses a firewall, assume that HTTP port 80 is used.
In addition to PivotTable Service, the client computer must be running an actual client OLAP application; for example, Excel, Office Web Components, or a third-party application. Thus, a thick-client OLAP architecture has a large footprint because a considerable portion of the application must be installed on each client computer.
A significant advantage of the thick-client approach is that the end users get quick, even response times from their queries because a much of the OLAP and display processing can be done right on the desktop. However, this approach can also be inefficient, because a large amount of data may have to be moved from the server to the desktop. To address the bandwidth and desktop footprint issues, look at using a thin-client approach.
You can use the reference architecture in Figure 1 for thin-client access. It has all of the required hardware and software to run an external Web site. Each Analysis server can provide Web services (using IIS) directly for clients on the Internet and Analysis Services to the ASP pages that are part of the Web application. In fact, you can offer both thin-client and thick-client services on the same servers using this approach.
Note If you plan to offer only thin-client services, do not install the Analysis Services HTTP access virtual directory and its associated interface (Msolap.asp).
However, many Web site designers prefer to place the Web server and database access software on different computers. In this case, consider the design depicted in Figure 4: The thin-client architecture builds on the architecture used in figures 1-3, but it adds a third tier on the Web site to provide additional processing. Because the client computers only have browsers installed, they require additional support from Web servers on the Web site before accessing the OLAP data. The Web application uses ASP pages and Microsoft ActiveX® Data Objects (Multidimensional) (ADO MD) to programmatically access the Analysis servers and format an HTML page that is rendered on the end user's browser.
Instead of providing access to the Analysis server cluster through HTTP and PivotTable Service through the Web server, the thin-client architecture provides access to the cluster using the client-server technique to port 2725. This means that the Analysis server cluster does not require SQL Server 2000 Enterprise Edition; it can use SQL Server Standard Edition (reducing the cost).
Figure 6 shows the thin-client architecture with dedicated Web servers. As before, the IP addresses and connections for different parts of the network are shown in different colors, as follows:
· The external network is shown as a red dashed line. This is also the heartbeat for the Web server cluster.
· The internal Analysis Services network is shown as a straight blue line. This is also the heartbeat for the Analysis server cluster.
· The internal database network is shown as a green dashed line.
· The internal database cluster heartbeat network is shown as a black dashed line.
Figure 6: Reference site architecture (thin-client) with dedicated Web servers
|
Computer |
Configuration |
|
Web1 |
Windows 2000 Advanced Server with Network
Load Balancing, |
|
Web2 |
Windows 2000 Advanced Server with Network
Load Balancing, |
|
Web3 |
Windows 2000 Advanced Server with Network
Load Balancing, |
|
VPN1 |
Windows 2000 Advanced Server with VPN,
PDC, DNS, |
|
VPN2 |
Windows 2000 Advanced Server with VPN,
BDC, secondary DNS, |
|
AS1 |
Windows 2000 Advanced Server with Network
Load Balancing, |
|
AS2 |
Windows 2000 Advanced Server with Network
Load Balancing, |
|
Computer (continued) |
Configuration (continued) |
|
AS3 |
Windows 2000 Advanced Server with Network
Load Balancing, |
|
Db1 |
Windows 2000 Advanced Server with Windows
Clustering, |
|
Db2 |
Windows 2000 Advanced Server with Windows
Clustering, |
Continuous Production
Using some of the techniques the reference architecture illustrates, you can design a facility that can be moved into production quickly. This is required if you want to maintain a production site that is online 24 hours a day, seven days a week. In many intranet applications, there is also a requirement to provide a staging facility for cubes. The result is a two-node subset of the reference architecture that can be used to place cubes into production with minimal impact on end users. Figure 7 shows the overall design.
Figure 7: Two-node reference site architecture (thin-client) with dedicated Web servers
|
Computer |
Configuration |
|
ASDb1 |
Windows 2000 Advanced Server with Windows
Clustering, |
|
ASDb2 |
Windows 2000 Advanced Server with Windows
Clustering, |
Note Each server has the same CPU, memory, and disk configuration.
In normal operation, Network Load Balancing is configured so that the load is evenly split between the two servers. Each server has an identical copy of the OLAP data; if one server fails or is taken offline for preventative maintenance or other scheduled activities, the other server automatically takes up the load. There is no interruption in service to end users.
To update the Analysis Services cluster
1. Select the server that you want to use as the staging server. This is the server on which you will load the data before posting it.
2. Drainstop the staging server until it no longer has any connections.
3. Start the staging ETL process and update the OLAP data.
4. Perform any validation required on the new data. After validation is complete and you are ready to move the data into production, copy the Data folder of the staging server into a different folder on the other server.
5. Drainstop the other server and add the staging server to the cluster. Existing connections continue, but new connections go to the staging server and end users see the new data.
6. After the other server has closed all of its connections, stop the MSSQLServerOLAPService service, change the Data folder, and then restart the MSSQLServerOLAPService service.
7. Add the other server to the cluster.
Both Analysis servers are now running with the new OLAP data, with no interruption to end users during the staging and posting process.
Finding More Information
The following links contain more information, resources, and downloadable material related to creating highly available Web and OLAP sites:
· Exploring Windows Clustering Technologies (Windows NT 4 .0 Enterprise Edition) site (http://www.microsoft.com/ntserver/ntserverenterprise/exec/overview/clustering/default.asp)
· Exploring Windows Clustering Technologies (Windows 2000 Advanced Server) site (http://www.microsoft.com/windows2000/guide/server/features/clustering.asp)
· Hardware Compatibility List (http://www.microsoft.com/hlc/)
· Microsoft Internet Explorer 5 home page (http://www.microsoft.com/windows/ie/default.htm)
· Lights-Out Operation Guide for Microsoft Windows NT Server (http://www.microsoft.com/ISN/downloads/P12303.asp)
· SQL Server 2000 home page (http://www.microsoft.com/sql/)
· Privacy Protected Network Access: Virtual Private Networking and Intranet Security (http://www.microsoft.com/WINDOWS2000/library/howitworks/security/comsec.asp)
· Tuning IIS for High-Volume Sites (http://msdn.microsoft.com/workshop/server/feature/tune.asp)
· Windows 2000 Server home page (http://www.microsoft.com/windows/server/)
· Microsoft Application Center 2000 home page (http://www.microsoft.com/applicationcenter/)
The following information about XML for Analysis is available:
· XML for Analysis Specification (http://msdn.microsoft.com/library/techart/xmlanalysis.htm)
· XML for Analysis SDK Download (http://msdn.microsoft.com/downloads/default.asp?URL=/code/sample.asp?url=/MSDN-FILES/027/001/633/msdncompositedoc.xml)
The following KB articles are also interesting:
· Q232711 - How Cluster Integrity Is Monitored in WLBS (http://support.microsoft.com/support/kb/articles/Q232/7/11.asp)
· Q240997 - Configuring Network Load Balancing (http://support.microsoft.com/support/kb/articles/Q240/9/97.asp)
· Q198496 - How to Configure WLBS Port Rules (http://support.microsoft.com/support/kb/articles/Q198/4/96.asp)
Appendix A:
A Step-by-Step Guide
This section provides step-by step-instructions for configuring Network Load Balancing on two servers (AS1 and AS2) and supporting infrastructure for the reference architecture.
Note This section assumes that the cluster is set up for even distribution across all hosts. Depending on the capacity of your servers, this may not be appropriate.
First, install Windows 2000 Advanced Server. Configure the two NIC cards with static IP addresses. Ensure that the DNS or WINS servers can map both of these IP addresses to the servers.
Install Analysis Services. If you are using the reference architecture, you must use SQL Server 2000 Enterprise Edition.
1. Log on as the administrator for Server 1 (AS1), and then log on as the administrator for Server 2 (AS2). For each server, verify the NIC configuration and that Network Load Balancing is installed.
2. In Control Panel, double-click Network and Dial-Up Connections. There should be at least two local area connections configured, one for each NIC. Rename the external NIC Cluster; rename the internal one Dedicated. Right-click Cluster, and then click Properties.
3. If Network Load Balancing is not listed, click Install. In the Select Network Component Type dialog box, click Service, and then click Add. Select Network Load Balancing, and then click OK.
4. Select Internet Protocol (TCP/IP) and then click Properties. Set the static IP addresses to:
· 192.168.18.168 (for Server 1)
· 192.168.18.169 (for Server 2)
5. Click OK to close the Internet Protocol (TCP/IP) Properties dialog box, and then click OK to close the Cluster Properties dialog box.
6. Right-click the local area connection named Dedicated, and then click Properties. Verify that the Network load balancing check box is cleared.
7. Click Internet Protocol (TCP/IP), and then click Properties. Set the static IP addresses to:
· 10.0.0.1 (for Server 1)
· 10.0.0.2 (for Server 2)
8. Click OK to close the Internet Protocol (TCP/IP) Properties dialog box, and then click OK to close the Dedicated Properties dialog box.
Next, configure Network Load Balancing on the two Analysis servers.
To configure Network Load Balancing on Server 1 (AS1)
1. In Control Panel, double-click Network and Dial-Up Connections. Right-click the local area connection named Cluster, and then click Properties.
2. Select the Network Load Balancing check box, and then click Properties. The Network Load Balancing Properties dialog box appears.
3. Click the Cluster Parameters tab. Specify the following values.
|
Parameter |
Value |
|
Primary IP address |
192.168.18.155 |
|
Subnet mask |
255.255.255.0 |
|
Full Internet name |
commerce.yourdomain.com |
|
Multicast support |
<disabled> |
|
Remote password |
<blank> |
|
Remote control |
<disabled> |
4. Click the Host Parameters tab. Specify the values in the Host parameters fields.
· In Priority (ID) specify 1, because this is the first host in the Network Load Balancing cluster. Specify the initial state as active.
· Type values for the dedicated IP address and subnet mask. These values are the unique IP addresses for each server in the Network Load Balancing cluster. In the reference site, add an IP address of 192.168.18.161 (AS1) with a subnet mask of 255.255.255.0.
5. Click the Port Rules tab, in which you modify the port rules to specify how you want Network Load Balancing to handle network traffic for specific ports. In this scenario, configure all ports to be the same. For other scenarios, you may want to select the actual ports being used.
6. Click the default port rule (0-65535). Set the filtering mode to Multiple hosts; no affinity. Click Modify, and then click OK.
7. Click the TCP/IP protocol, and then click Properties. Click Advanced.
8. Click Add and add the IP address for the Network Load Balancing cluster (192.168.18.155) and the computer (if an IP address is not present), and then click OK.
Server 1 is complete. In the next step, configure Server 2.
To configure Network Load Balancing on Server 2 (AS2)
1. In Control Panel, double-click Network and Dial-Up Connections. Right-click Cluster, and then click Properties.
2. Select the Network Load Balancing check box, and then click Properties. The Network Load Balancing Properties dialog box appears.
3. Click the Cluster Parameters tab, and specify the following values.
|
Parameter |
Value |
|
Primary IP address |
192.168.18.155 |
|
Subnet mask |
255.255.255.0 |
|
Full Internet name |
commerce.yourdomain.com |
|
Multicast support |
<disabled> |
|
Remote password |
<blank> |
|
Remote control |
<disabled> |
4. Click the Host Parameters tab. Specify the values in the Host parameters fields.
· In the Priority (ID) field, specify a unique, sequential number. Specify 2, because this is the second host in the Network Load Balancing cluster. Specify the initial state as active.
· Type values for the dedicated IP address and subnet mask. These values are the unique IP addresses for each server in the Network Load Balancing cluster. In the reference site, add an IP address of 192.168.18.162 (AS2) with a subnet mask of 255.255.255.0.
5. Click the Port Rules tab, in which you modify the port rules to specify how you want Network Load Balancing to handle network traffic for specific ports. In this scenario, configure all ports to be the same. In other scenarios, you may want to select the actual ports being used.
6. Click the default port rule (0-65535), Set the filtering mode to Multiple hosts; no affinity. Click Modify, and then click OK.
7. Click the TCP/IP protocol, and then click Properties. Click Advanced. Click the Add button and add the IP address for the computer (if not present) and for the Network Load Balancing cluster (192.168.18.155). Click OK.
Notice that again you configured both servers the same way. When you use Network Load Balancing directly, you must set up each server manually.
Now that Network Load Balancing is running on both nodes in the cluster, try some queries to check the balance between servers.
To verify that Network Load Balancing is working correctly
1. Place the following file in the IIS root of AS1:
(C:\Inetpub\wwwroot\nlb.asp)
<%Response.Expires = -1 %>
<head>
<title>AS1</title>
</head>
<body>
Page being serviced by: AS1
</TABLE>
</body>
2. Place the following file in the IIS root of AS2:
(C:\Inetpub\wwwroot\nlb.asp)
<%Response.Expires = -1 %>
<head>
<title>AS2</title>
</head>
<body>
Page being serviced by: AS2
</TABLE>
</body>
3. Start Internet Explorer approximately 20 times with a target of http://192.168.18.155/ (or the cluster name if you have a DNS entry). You should see some of the instances report AS1 and others report AS2. You must start a new instance of Internet Explorer each time. Refreshing the page does not establish the IP connection.
Appendix B:
Command-Line Tool
This appendix contains the Help file for wlbs, which is a command-line tool for managing a Network Load Balancing cluster.
C:\> WLBS /?
WLBS Cluster Control Utility V2.3. (c) 1997-99 Microsoft Corporation
Usage: WLBS <command> [<cluster>[:<host>]
[/PASSW [<password>]] [/PORT <port>]]
<command>
help - displays online Help
ip2mac <cluster> - converts cluster IP to cluster MAC address
reload - reloads parameters from the registry
query - queries which hosts are currently part of the cluster
display - displays configuration parameters, current
status, and last several event log messages
suspend - suspend control over cluster operations
resume - resume control over cluster operations
start - starts cluster operations
stop - stops cluster operations
drainstop - finishes all existing connections and
stops cluster operations
enable <port> | ALL - enables traffic for <port> rule or ALL ports
disable <port> | ALL - disables ALL traffic for <port> rule or ALL ports
drain <port> | ALL - disables NEW traffic for <port> rule or ALL ports
Remote options:
<cluster> - cluster name | cluster primary IP address
<host> - host within the cluster (default - ALL hosts):
dedicated name | IP address |
host priority ID (1..32) | 0 for current DEFAULT host
/PASSW <password> - remote control password (default - NONE)
blank <password> for console prompt
/PORT <port> - cluster's remote control UDP port
To access the Network Load Balancing Help file, issue the following command. This is the most complete documentation available for Network Load Balancing:
C:\> WLBS HELP
Appendix C:
Sample Scripts
This appendix provides sample scripts for working with Network Load Balancing and Analysis Services. The scripts perform functions such as stopping and starting Network Load Balancing and Analysis Services, changing the Analysis Services Data folder, and moving the repository from the Bin folder to the Data folder.
Other excellent
sources of sample scripts for Network Load Balancing are located at:
http://msdn.microsoft.com/library/psdk/mscs/nlb_using_2dir.htm
and http://msdn.microsoft.com/library/psdk/mscs/nlb_using_2uue.htm
The following scripts are provided in this section:
· Stopping and starting Network Load Balancing using a DOS shell command and a Windows Management Instrumentation (WMI) call
· Invoking a DTS job to start processing on the staging server
· Stopping and starting the MSSQLServerOLAPService service
· Changing the Analysis Services Data folder
· Moving the repository from the Bin folder to the Data folder
The first three are provided in Set 1. The remaining two are provided in Set 2.
Note The following code is part of a much larger system. It is provided as a sample to give you a feeling for the kinds of scripts that you can write. The code does not run directly. Second, not all of the code is directly applicable to OLAP processing and Network Load Balancing. Some of the code illustrates best practices, such as keeping an application log of when various steps are executed, interfacing with the event log in Windows 2000, and so on.
Set 1
'/*******************************************************************
'File: PostProcess.vbs
'Author:
'Version:
'LastModified:
'NOTE: Should be run on staging SQL Server
'/*******************************************************************
Dim strSQLConnect, strSQL, strErrDesc, strDataDrive
Dim strCluster, strServer, strFile, strAggregator, strFilePath
Dim strOLAP2
Dim intJobID
Dim objArgs, objNW, objFS, objConn
Dim rs, rsMon
Dim aryDay(7)
strOLAP1 = "SERVER1"
strOLAP2 = "SERVER2"
strOLAP1ID = "2"
strOLAP2ID = "1"
strOLAPIP = "192.168.18.155"
strFolder1 = "\\" & strOLAP2 & "\OLAP\Data"
strFolder2 = "\\" & strOLAP2 & "\OLAP\DataNew"
'On Error Resume Next
'\\Object Creation
Set objConn = CreateObject("ADODB.Connection")
Set objShell = WScript.CreateObject("WScript.Shell")
Set objConnCS = CreateObject("ADODB.Connection")
Set objNW = CreateObject("WScript.NetWork")
Set objFS = CreateObject("Scripting.FileSystemObject")
WScript.Echo("Enter PostProcess")
If Err.Number <> 0 Then
objShell.LogEvent 1, "PostProcess.vbs: Could not necessary objects. Error No:" & _
Err.Number & " Error Description:" & Err.Description
WScript.Echo("object error")
Err.Clear
WScript.Quit
End If
'//Get Local Name
strLocalMachine = objNW.ComputerName
Set objNW = Nothing
'//Populating the Day Array
aryDay(1) = "Sun"
aryDay(2) = "Mon"
aryDay(3) = "Tue"
aryDay(4) = "Wed"
aryDay(5) = "Thu"
aryDay(6) = "Fri"
aryDay(7) = "Sat"
intDay = WeekDay(Now())
strSuffix = aryDay(intDay)
'\\StatsMon SQL Connect
sUID = "sa"
sPWD = "password"
sDB = "StatsDb"
sServer = "MONITOR"
strSQLConnect = "Driver={SQL Server};UID=" & sUID & ";PWD=" & sPWD & _
";LANGUAGE=us_english;DATABASE=" & sDB & ";SERVER=" & sSERVER
objConn.Open strSQLConnect
If Err.Number <> 0 Then
objShell.LogEvent 1, "PostProcess.vbs: Could not connect to Server-" & sServer & " Database-" & _
sDB & " Error Number-" & Err.Number & " Error Description-" & Err.Description
Err.Clear
'WScript.Quit
End If
'//Get the count of jobs that are not in PostProcess
strSQL = "up_getCountPostProcessNotReady"
set rsMon = objConn.Execute(strSQL)
intCount = rsMon("NotReady")
'//Get whether the OLAP/PostProcess is running
strSQL = "up_getOLAPRunning"
set rsMon = objConn.Execute(strSQL)
intRunning = rsMon("Value")
If intCount <> 0 OR intRunning = 1 Then
WScript.Quit
End If
objShell.LogEvent 4, "PostProcess.vbs: Process Started"
strSQL = "up_setOLAPRunning 1"
intReturn = objConn.Execute(strSQL)
'\\CS SQL Connect
strUID = "sa"
strPWD = "password"
strDB = "Master"
strServer = "SERVER1"
strSQLConnect = "Driver={SQL Server};UID=" & strUID & ";PWD=" & strPWD & _
";LANGUAGE=us_english;DATABASE=" & strDB & ";SERVER=" & strSERVER
objConnCS.ConnectionTimeOut = 3600
objConnCS.CommandTimeOut = 3600
objConnCS.Open strSQLConnect
If Err.Number <> 0 Then
objShell.LogEvent 1, "PostProcess.vbs: Could not connect to Server-" & strServer & " Database-" & _
strDB & " Error Number-" & Err.Number & " Error Description-" & Err.Description
Err.Clear
'strSQL = "up_setOLAPRunning 0"
'intReturn = objConn.Execute(strSQL)
'WScript.Quit
End If
strSQL = "up_getPostProcessToRun"
set rs = objConn.Execute(strSQL)
'//Remove first OLAP server out of NETWORK LOAD BALANCING
'//Change to WMI call
suspendNLB strOLAP1,strOLAPIP,strOLAP1ID
'// or could be
'// strCommand = "WLBS suspend " & strOLAPIP & ":" & strOLAP1ID & " /PASSW Spit2Drive!"
'// WScript.Echo strCommand
'// IntReturn = objShell.Run(strCommand, 1, TRUE)
'//Restart the service to clear any hanging connections
stopOLAPService strOLAP1
startOLAPService strOLAP1
WScript.Sleep(120000)
startOLAPService strOLAP1
WScript.Sleep(120000)
'//INCREMENTAL
WScript.Echo("Incremental Start")
objShell.LogEvent 4, "PostProcess.vbs: Incremental Begin"
Do While Not rs.EOF
strCluster = rs("Cluster")
intBuildOlap = rs("BuildOlap")
strSQL = "exec " & strCluster & ".dbo.PostProcess"
WScript.Echo("strSQL: " & strSQL)
intReturn = objConnCS.Execute(strSQL)
If intBuildOlap = 1 Then
strCommand = "cscript c:\scripts\Cubes.vbs " & strCluster
WScript.Echo("strCommand: " & strCommand)
intReturn = objShell.Run(strCommand, 1, FALSE)
End If
rs.MoveNext()
Loop
WScript.Echo("Incremental Finished")
objShell.LogEvent 4, "PostProcess.vbs: Incremental Finished"
'//Finished
strSQL = "up_getCountPostProcessRunning"
set rs = objConn.Execute(strSQL)
intCount = rs("Count")
Do While intCount <> 0
WScript.Sleep(6000)
strSQL = "up_getCountPostProcessRunning"
set rs = objConn.Execute(strSQL)
intCount = rs("Count")
Loop
'//Stop service to release source files
stopOLAPService strOLAP1
'//OLAP ARCHIVE
objShell.LogEvent 4, "PostProcess.vbs: Archive Begin"
strCommand = "robocopy " & Chr(34) & "\\" & strOLAP1 & "\e$\Microsoft Analysis Services\Data" & Chr(34) & _
" " & Chr(34) & "\\" & strOLAP2 & "\MAS\DataNew" & Chr(34) & " /S"
WScript.Echo(strCommand)
intReturn = objShell.Run(strCommand, 1, TRUE)
WScript.Echo("intReurn:" & intReturn)
WScript.Echo("Archive Finished")
objShell.LogEvent 4, "PostProcess.vbs: Archive Finished"
'//Finished
'//Reactivate the first OLAP server
startOLAPService strOLAP1
resumeNLB strOLAP1,strOLAPIP,strOLAP1ID
'// or could be
'// WScript.Sleep(120000)
'// strCommand = "WLBS resume " & strOLAPIP & ":" & strOLAP1ID & " /PASSW Spit2Drive!"
'// WScript.Echo strCommand
'// intReturn = objShell.Run(strCommand, 1, TRUE)
'// strCommand = "WLBS start " & strOLAPIP & ":" & strOLAP1ID & " /PASSW Spit2Drive!"
'// WScript.Echo strCommand
'// intReturn = objShell.Run(strCommand, 1, TRUE)
'//Remove second OLAP server and stop OLAP service
suspendNLB strOLAP2,strOLAPIP,strOLAP2ID
'// or could be
'// strCommand = "WLBS suspend " & strOLAPIP & ":" & strOLAP2ID & " /PASSW Spit2Drive!"
'// WScript.Echo strCommand
'// intReturn = objShell.Run(strCommand, 1, TRUE)
stopOLAPService strOLAP2
'//OLAP RESTORE
WScript.Echo("Restore Begin")
objShell.LogEvent 4, "PostProcess.vbs: Restore Begin"
DeleteFolder strFolder1
MoveFolder strFolder2, strFolder1
strCommand = "dtsrun /F C:\scripts\CopyOLAPObjectsTable.dts /L C:\temp\CopyOLAPObjectsTable.txt"
WScript.Echo strCommand
intReturn = objShell.Run(strCommand, 1, TRUE)
startOLAPService strOLAP2
WScript.Sleep(120000)
initOLAP strOLAP2 'Touch the OLAP databases
objShell.LogEvent 4, "PostProcess.vbs: Restore Finished"
WScript.Echo("Restore Finished")
'//Finished
'// Reactivate second OLAP server
resumeNLB strOLAP2,strOLAPIP,strOLAP2ID
'// or could be
'// strCommand = "WLBS resume " & strOLAPIP & ":" & strOLAP2ID & " /PASSW Spit2Drive!"
'// WScript.Echo strCommand
'// intReturn = objShell.Run(strCommand, 1, TRUE)
'// strCommand = "WLBS start " & strOLAPIP & ":" & strOLAP2ID & " /PASSW Spit2Drive!"
'// WScript.Echo strCommand
'// intReturn = objShell.Run(strCommand, 1, TRUE)
objShell.LogEvent 4, "PostProcess.vbs: PostProcess Finished"
set objShell = Nothing
set rs = Nothing
set objConn = Nothing
set objConnCS = Nothing
WScript.Quit
'//FUNCTIONS
Function suspendNLB(strOLAP, strIP,strOrder)
Set NLBNode = GetObject("winmgmts:\\" & strOLAP & "\root\MicrosoftNLB:MicrosoftNLB_Node.Name='" & _
strIP & ":" & strOrder & "'")
a = NLBNode.suspend()
WScript.Echo(a)
End Function
Function resumeNLB(strOLAP, strIP,strOrder)
Set NLBNode = GetObject("winmgmts:\\" & strOLAP & "\root\MicrosoftNLB:MicrosoftNLB_Node.Name='" & _
strIP & ":" & strOrder & "'")
a = NLBNode.resume()
WScript.Echo(a)
a = NLBNode.start()
WScript.Echo(a)
End Function
Function initOLAP(strOLAP)
If err.number > 0 then
objShell.LogEvent 1, "PostProcess.vbs: initOLAP Failed Server-" & strOLAP
End If
Dim dsoServer
Dim dsoDatabase
Dim sta
Set dsoDatabase = CreateObject("DSO.MDStore")
Set dsoServer = CreateObject("DSO.Server")
dsoServer.Connect strOLAP
dsoServer.Refresh
For Each dsoDatabase In dsoServer.MDStores
sta = dsoDatabase.State
WScript.Echo(dsoDatabase.Name)
Next
End Function
Function startOLAPService(strOLAP)
Dim objService
set objService = GetObject("winmgmts://" & strOLAP & _
"/root/cimv2:Win32_Service.Name='MSSQLServerOLAPService'")
WScript.Sleep(6000)
b = objService.StartService()
set objService = Nothing
End Function
Function stopOLAPService(strOLAP)
Dim objService
set objService = GetObject("winmgmts://" & strOLAP & _
"/root/cimv2:Win32_Service.Name='MSSQLServerOLAPService'")
WScript.Sleep(6000)
b = objService.StopService()
set objService = Nothing
End Function
Function DeleteFolder(folderspec)
objFS.DeleteFolder folderspec
End Function
Function MoveFolder(fldrspec1,fldrspec2)
objFS.MoveFolder fldrspec1, fldrspec2
End Function
Set 2
These scripts must run on the Analysis server itself. They cannot be invoked remotely.
Function changeOLAPDataFolder(strDF)
Dim objWSHShell
Dim strKey
strKey = "HKEY_LOCAL_MACHINE\SOFTWARE\Microsoft\OLAP
Server\CurrentVersion\RootDir"
Set objWSHShell = CreateObject("WScript.Shell")
objWSHShell.RegWrite( strKey, strDF, "REG_SZ")
End Function
Function moveRepository(strDestFolder)
'// NOTE: msmdrep.mdf file must already exist in the destination folder
'// for example, C:\Program Files\Microsoft Analysis Services\Data (no ending "\" in folder name)
Dim strDF
Dim objWSHShell
Dim strKey
' update the locks directory
strKey = "HKEY_LOCAL_MACHINE\SOFTWARE\Microsoft\OLAP Server\Server Connection Info\"
objWSHShell.RegWrite( strKey & "Locks Directory", strDestFolder, "REG_SZ")
' update the repository connect string
strDF = "Provider=Microsoft.Jet.OLEDB.4.0;Data Source=" & strDestFolder & "\msmdrep.mdb"
objWSHShell.RegWrite( strKey & "Repository Connection String", strDF, "REG_SZ")
' update the MsOLAPRepository$ file share
' TBD
End Function
Appendix D:
Cluster Service Configuration
This appendix provides the steps necessary to configure Analysis Services in a server cluster. As shown in the reference architecture, it is not the recommended approach for building large-scale, highly available OLAP sites. The recommended technique is to use Network Load Balancing clusters or a combination of Network Load Balancing clusters and server clusters. However, server clusters are a commonly used clustering technology in other areas, notably for SQL Server, and it may be an appropriate alternative for some systems.
Important Analysis Services is not designed for and tested in a clustered server configuration. While the configuration is not officially supported, Microsoft Product Support Services (PSS) will make their best effort to support a clustered installation. To further research the problem, PSS may request that the customer uncluster the systems to see if the problem can be reproduced. In addition, there is no guarantee that the registry entries will remain synchronized or that failover will work like a cluster-aware application. You should communicate with your PSS contact before implementing Analysis Services on a server cluster.
Applications that run in a server cluster fall into one of four categories:
· Cluster-unaware applications. These applications do not interact with the server cluster but can still perform well in it.
· Cluster-aware applications. These applications achieve optimal performance by implementing awareness of the cluster environment, allowing them to react to cluster events.
· Cluster management applications. These applications, such as Cluster Administrator and Cluster.exe, allow administrators to manage and configure clusters.
· Custom resource types. These applications provide customized cluster management for applications, services, and devices.
Analysis Services is a cluster-unaware application. However, through the generic service facility of the Cluster service, you can configure it within a clustered environment to gain a high availability solution for your OLAP configuration.
1. Install Analysis Services locally on both nodes of the cluster with the data directories stored on the shared cluster drive. You can specify the data directories during installation, or change them manually in the following registry key:
HKEY_LOCAL_MACHINE\SOFTWARE\Microsoft\OLAP Server\CurrentVersion
2. Move the Analysis Services repository to the shared cluster drive. If the Analysis Services repository is in Access (the default at installation), the repository file (Msmdrep.mdb) must be moved to a shared resource. Manually change the registry keys for the Repository Connection String and RemoteRepositoryConnectionString on both servers to point to the new location.
Usually, the connection to the repository file is made using the MSOLAPRepository$ share. The MSOLAPRepository$ share is created by Analysis Services during setup, and it points to the Bin directory.
First, unshare the Bin directory on each server, and then share the corresponding directory as MSOLAPRepository$ on the shared resource. Grant full control permissions to members of the Administrators and OLAP Administrators groups.
Then, modify the registry entries in HKEY_LOCAL_MACHINE\SOFTWARE\ Microsoft\OLAP Server\Server Connection Info as appropriate. The Locks Directory and Remote Locks Directory registry entries should point to the shared resource disk.
However, rather than moving the Access version of the repository to a different location, the preferred solution is to migrate the repository to SQL Server on one instance and then copy the registry keys for the Repository Connection String and RemoteRepositoryConnectionString from the server to which the repository was migrated to the other node in the server cluster. SQL Server is the preferred location for Analysis Services meta data in enterprise deployments.
3. In Cluster Administrator, create a generic service to run Msmdsrv.exe (the Analysis executable). Create a new resource as type Generic Service. Both nodes should be owners, and both should move the cluster disk as a dependency for the resource. The name of the service should be MSSQLServerOLAPService and the Startup parameter should be net start MSSQLServerOLAPService. Analysis Services should now be controlled through Cluster Administrator.
4. Set the shared cluster disk with the data (and repository) to move over as part of the same cluster group on failover. Set the MSSQLServerOLAPService service to start on the other node on failover.
5. Set the MSSQLServerOLAPService to start up manually in Windows 2000.
As you can see, one of the most important operational issues in the server cluster is the coordination of registry changes across nodes. Because Analysis Services is not cluster-aware, you must make modifications, such as the location of the repository or other modifications to the registry, manually in all servers. The generic service facility can be used to start the MSSQLServerOLAPService process, but it does not coordinate other sources of information, such as the server properties that are set using Analysis Manager but stored in the registry.
|
|